Z-Axis Effect
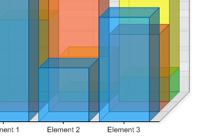
Using multiple axes with series can yield some interesting results you may not be aware of. We'll explore a situation that simulates a z axis. A basic z axis can be simulated by setting the x axis ClusterColumns property to false:
[C#]Chart.XAxis.ClusterColumns = false;
[Visual Basic]Chart.XAxis.ClusterColumns = false
This may show a chart that looks like this:

 |
Gantt chart tip: The CluseterColumns feature is only available when Chart.Use3D = true, however, it is still possible to use this feature in 2D by using 3D but emulating a 2D chart by setting the Chart.Depth property to zero. This trick may be most useful when creating Gantt charts which require element columns from different series (but using the same element names) to occupy the same horizontal space (with vertical 'Combo') or vertical space with ComboHorizontal charts. |
Using X Axes
This works well however if we wanted a z axis with two steps and two clustered series on each step we will have to use two X axes. This time we will also omit setting the cluster columns property to false.
[C#]Axis a2 = new Axis();
mySC[0].XAxis = a2;
mySC[1].XAxis = a2;
a2.Clear();
[Visual Basic]Dim a2 As New Axis()
mySC(0).XAxis = a2
mySC(1).XAxis = a2
a2.Clear()
 |
We "Clear()" the second axis so that only the original one is visible. |
 |
|
[C#]Axis a2 = new Axis();
mySC[0].YAxis = a2;
mySC[1].YAxis = a2;
a2.Scale = Scale.Stacked;
[Visual Basic]Dim a2 As New Axis()
mySC(0).YAxis = a2
mySC(1).YAxis = a2
a2.Scale = Scale.Stacked

Notice that the new y axis is stacked but still the main x axis manages the clustered - unclustered layout. Therefore if we wanted to uncluster the columns we could have multiple z axis steps and some may be stacked while other wont.
[C#]Chart.XAxis.ClusterColumns = false;
[Visual Basic]Chart.XAxis.ClusterColumns = false

 |
Please note that using multiple value axes while hiding one of them may result in one going out of sync with the other. This will result in the bars indicating incorrect values (according to the visible value axis). This issue can be resolved by synchronizing the visible with the invisible axes. For more information see the scale synchronization tutorial. |
 |
Sample: AxisDualScales.aspx |


